 |
News | Sport | TV | Radio | Education | TV Licenses | Contact Us |
|
News | Sport | TV | Radio | Education | TV Licenses | Contact Us |
TRC Final ReportPage Number (Original) 424 Paragraph Numbers 90 to 92 Volume 2 Chapter 5 Subsection 15 Responsibility for gross violations of human rights90 The table below indicates the percentage of types of gross violations which were reported to the Commission for this period (1983-89):
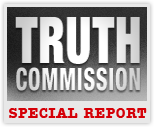
91 The table indicates a sharp increase in killings in homelands for this period, bringing them in line with the rest of the country. Severe ill treatment in the homelands drops (from 74 per cent of homeland violations in the 1976-82 period to 52 per cent), while torture and abductions remain similar to the last period. 92 Figure 154 shows a sudden and dramatic increase in the number of violations reported in KwaZulu (note that the scale on this graph has changed since the last in this series, indicating a substantial increase in violations reported). KwaNdebele also shows a large number of violations in that region: see the separate section on KwaNdebele below for more on these conflicts. Figure 161 shows a huge increase in the number of violations ascribed to the liberation movements and Inkatha in this period. However, the homelands police are still the main perpetrator group and, when the SAP perpetrator group is taken into account, it is clear that the security forces are still the main perpetrators in the homelands for this period. 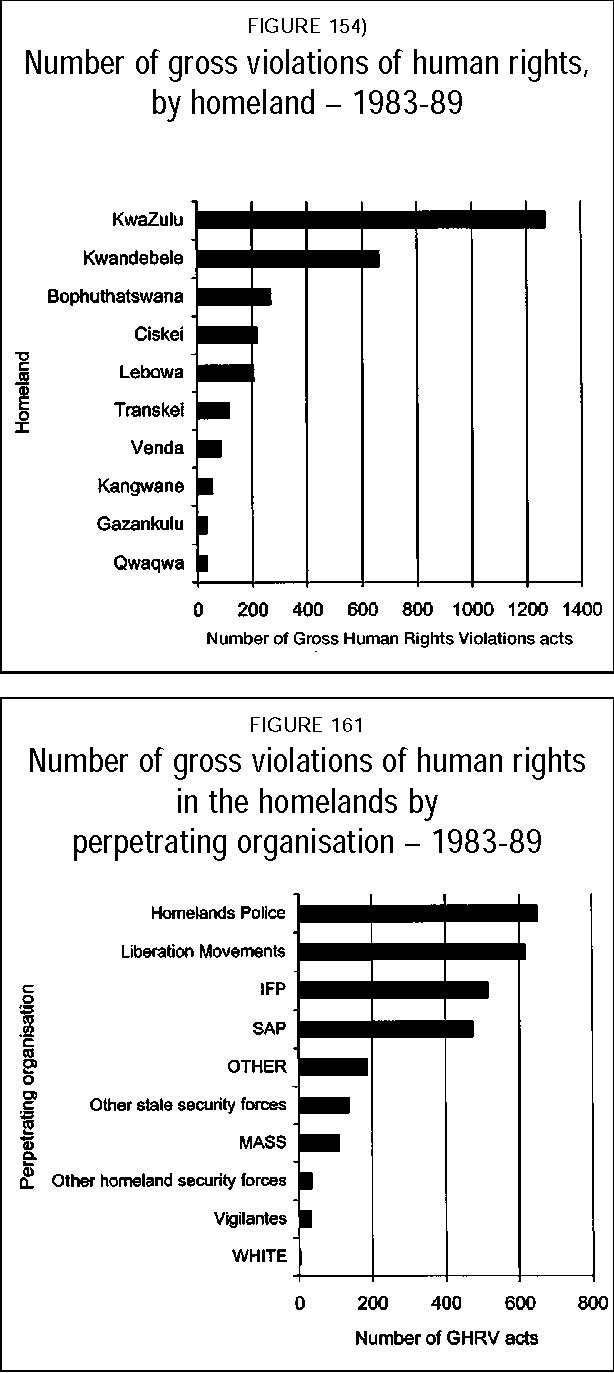
|