 |
News | Sport | TV | Radio | Education | TV Licenses | Contact Us |
|
News | Sport | TV | Radio | Education | TV Licenses | Contact Us |
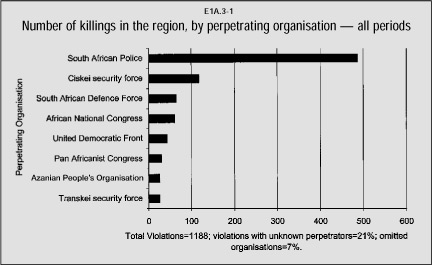
TRC Final ReportPage Number (Original) 152 Paragraph Numbers 9 to 16 Volume 3 Chapter 2 Subsection 38 Perpetrator organisations9 The top eight organisations allegedly responsible for killings in the area covered by the East London office area were as follows: 10 The security forces dominate the chart, with killings attributed to the South African Police (SAP), Ciskei security forces and SADF making up the most cases. Black political organisations account for the rest of the killings, except for a small number attributed to the Transkei security forces. Killings by the the SAP, Ciskei security forces and SADF show a peak similar to killings allegedly committed by the SAP during the states of emergency years:
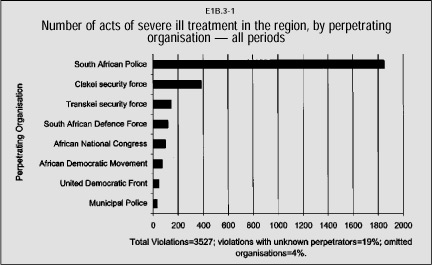
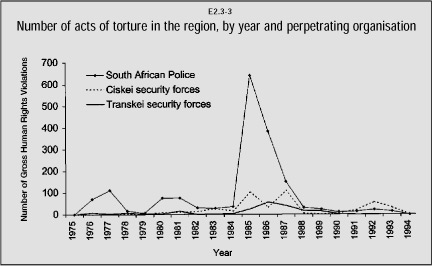
11 Unlike the national picture, the Eastern Cape does not reflect a peak in the killings attributed to the SAP in 1976 (the Soweto uprising), but the states of emergency peak does appear. In 1992, a number of killings attributed to the Ciskei security forces can be seen. The SAP also dominate the chart of severe ill treatment violations: 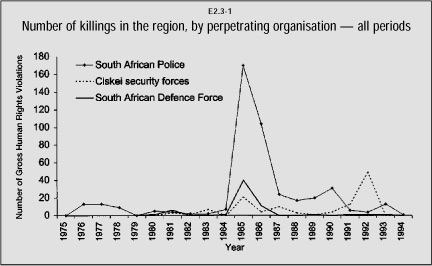 12 Overwhelmingly, the greatest number of instances of severe ill treatment are attributed to the SAP, followed by the Ciskei security forces and the SADF. The severe ill treatment violations attributed to the top three organisations change over time as follows: 13 The pattern of severe ill treatment closely matches that of killings, with allegations against the SAP dominating the peak in the mid-eighties and tailing off in the early 1990s. The number of allegations of severe ill treatment by the Ciskei security forces reaches a peak in 1992. 14 As in the national picture, the SAP dominates torture violations, with nearly 2 000 allegations:
15 The security forces of both Ciskei and Transkei also feature strongly. Again, the pattern of alleged torture over time shows that torture was at its worst during the states of emergency:
16 The greatest number of torture cases attributed to the SAP occurs in 1985, then drops in 1986. In the national picture, by contrast, it shows an increase in 1986. |