 |
News | Sport | TV | Radio | Education | TV Licenses | Contact Us |
 |
News | Sport | TV | Radio | Education | TV Licenses | Contact Us |
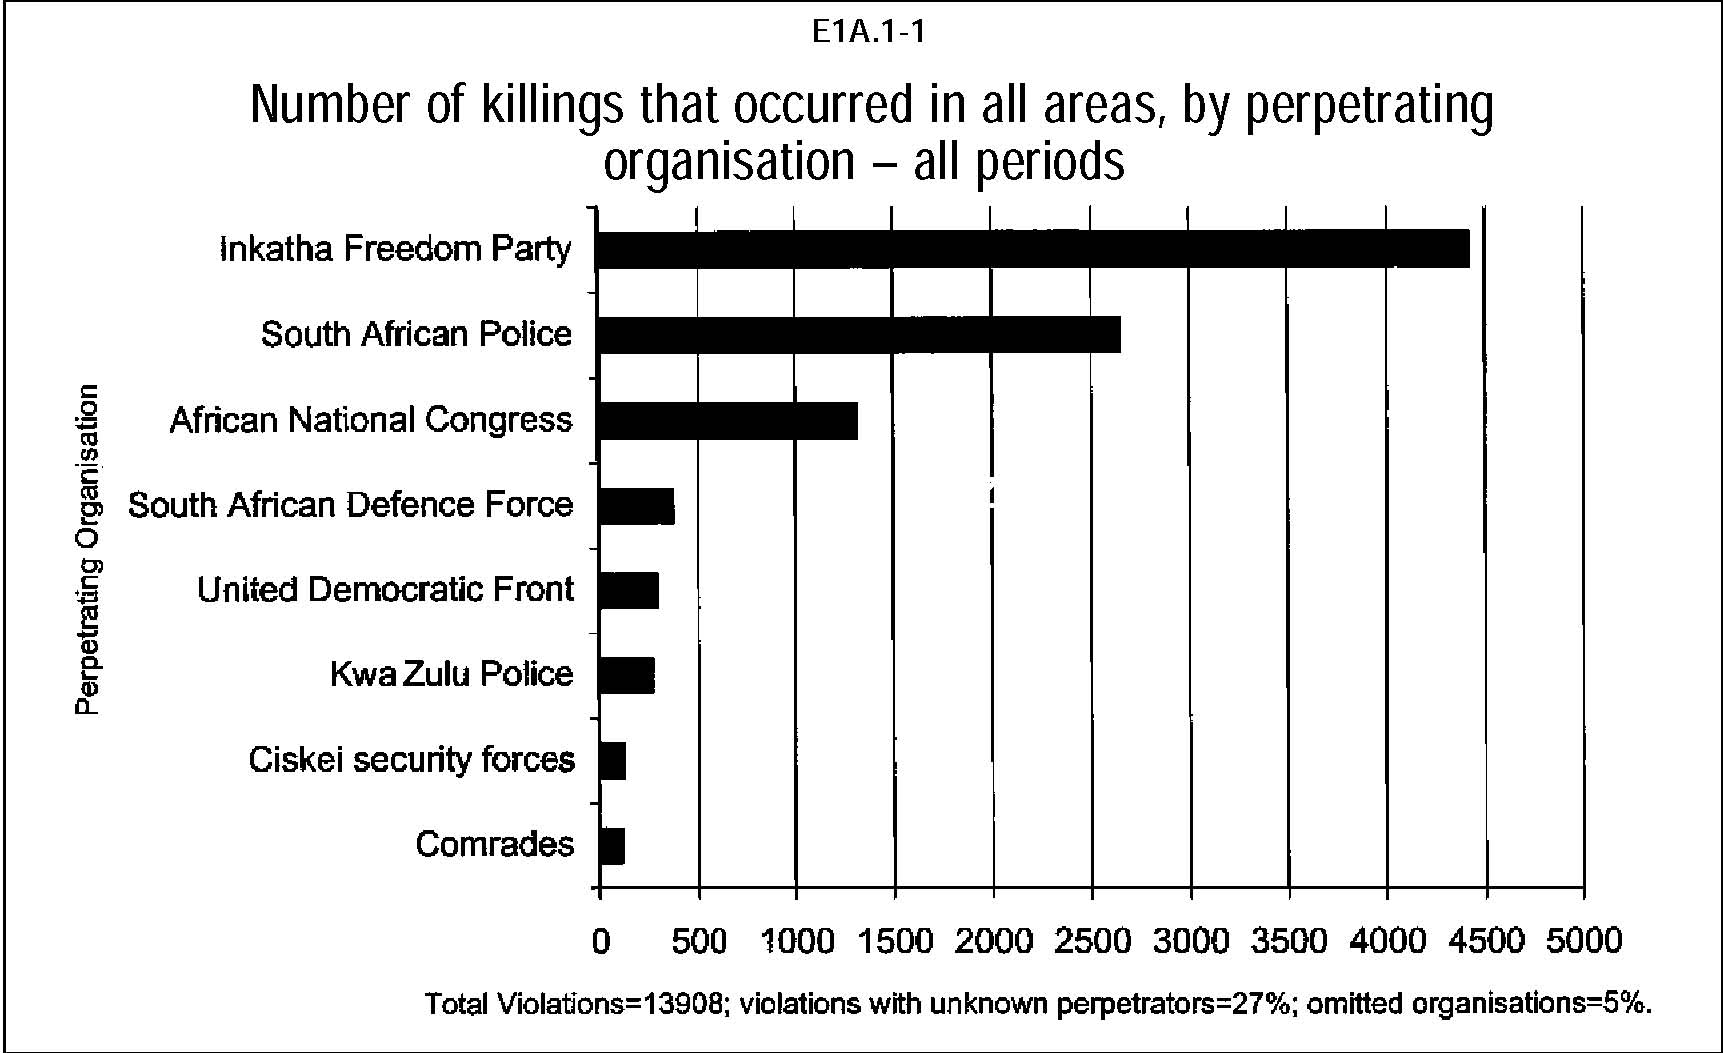
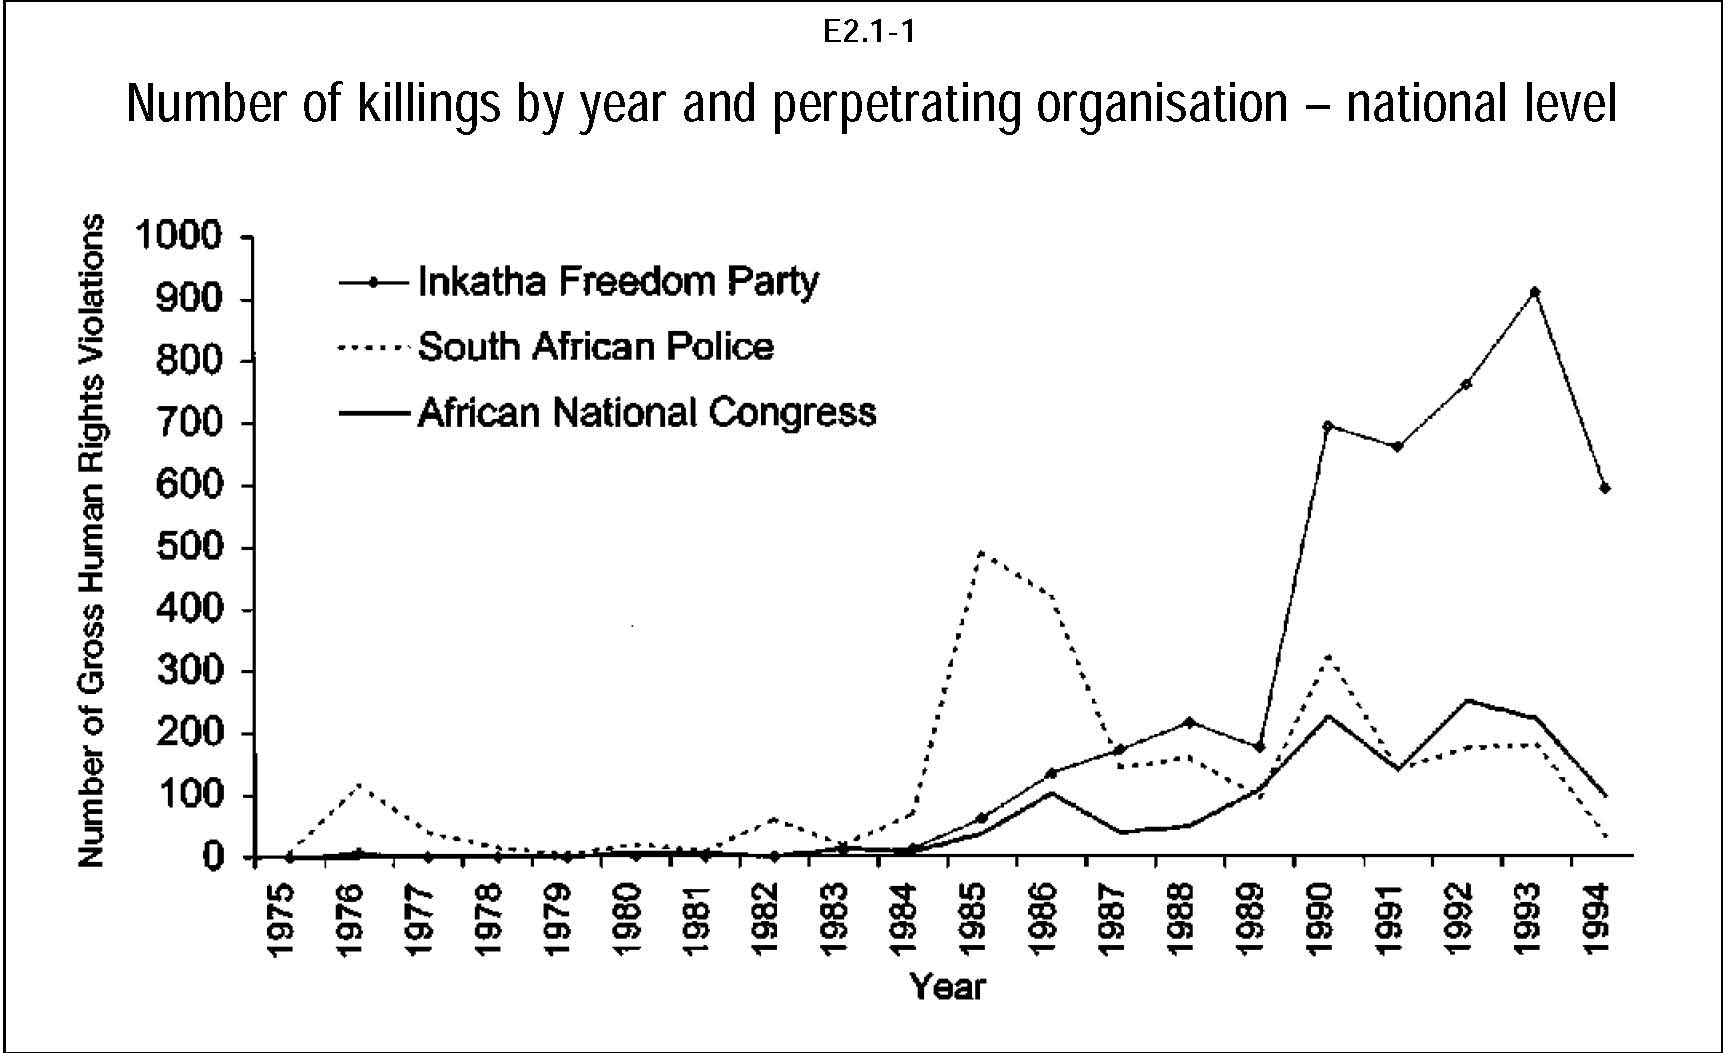
TRC Final ReportPage Number (Original) 9 Paragraph Numbers 32 to 41 Volume 3 Chapter 1 Subsection 5 Perpetrator organisations32 The picture is not complete without looking at the alleged organisational allegiance of the perpetrators. Deponents were asked about the organisation to which they thought the perpetrators belonged. The top eight responses for instances involving killings were as follows: 33 The number of violations allegedly committed by the IFP dominates the graph, with the SAP and the ANC showing the second and third highest numbers of alleged violations. These figures show the total number of killings over the whole period, but different organisations were allegedly active at different times. The chart below shows how the alleged violations by the top three organisations changed over time:  34 The chart shows how the killings allegedly committed by the SAP feature during all periods8, with peaks in 1976 (the Soweto uprising), 1985 to 1987 (states of emergency) and 1990 (the unbanning of organisations), followed by a steady decrease in killings during the 1990s.  35 Killings attributed to the ANC9 peak in 1986, a year after the peak of SAP killings, and then increase steadily during the 1990s after a lull in the late 1980s. 36 Killings attributed to the IFP start increasing at the same time as those of the ANC in 1986, and carry on increasing during the late 1980s, at a time when the alleged violations of the SAP and ANC experienced a comparative lull. There is a steep increase after the unbanning of the ANC, reaching an all-time high in 1993. 37 The patterns of severe ill treatment are similar to those of killings, with the SAP, IFP and ANC at the top of the list of alleged violations: 38 The greatest number of instances of severe ill treatment are attributed to the SAP, followed by the IFP, with over 7 000 alleged violations each, followed by the ANC with over 2 000. Again, the pattern is different at different periods of history, and matches the pattern of alleged killings closely: 39 There is a peak of severe ill treatment violations allegedly committed by the SAP in 1976, followed by a great increase in 1985 and 1986 during the states of emergency, then a lull followed by another peak in 1990, and then a steady decrease from that peak during the 1990s. 40 Violence attributed to the ANC peaks in 1986, then drops, after which it increases to another peak in 1990 and then remains relatively constant during the 1990s. 41 Violations attributed to the IFP show an increase in 1985, a steady rise all through the late 1980s, and then a steep increase in 1990, followed by two more increases during the early 1990s. |