 |
News | Sport | TV | Radio | Education | TV Licenses | Contact Us |
 |
News | Sport | TV | Radio | Education | TV Licenses | Contact Us |
TRC Final ReportPage Number (Original) 402 Paragraph Numbers 11 to 15 Volume 2 Chapter 5 Subsection 2 Overview of violations 1960-199411 The table below records the percentage, by type, of gross human rights violations that occurred in the homelands for all periods and is measured against the equivalent figures for non-homeland areas. Counts are done throughout the 1960-94 period on all ten geographical areas that were eventually to become either self-governing or independent territories.
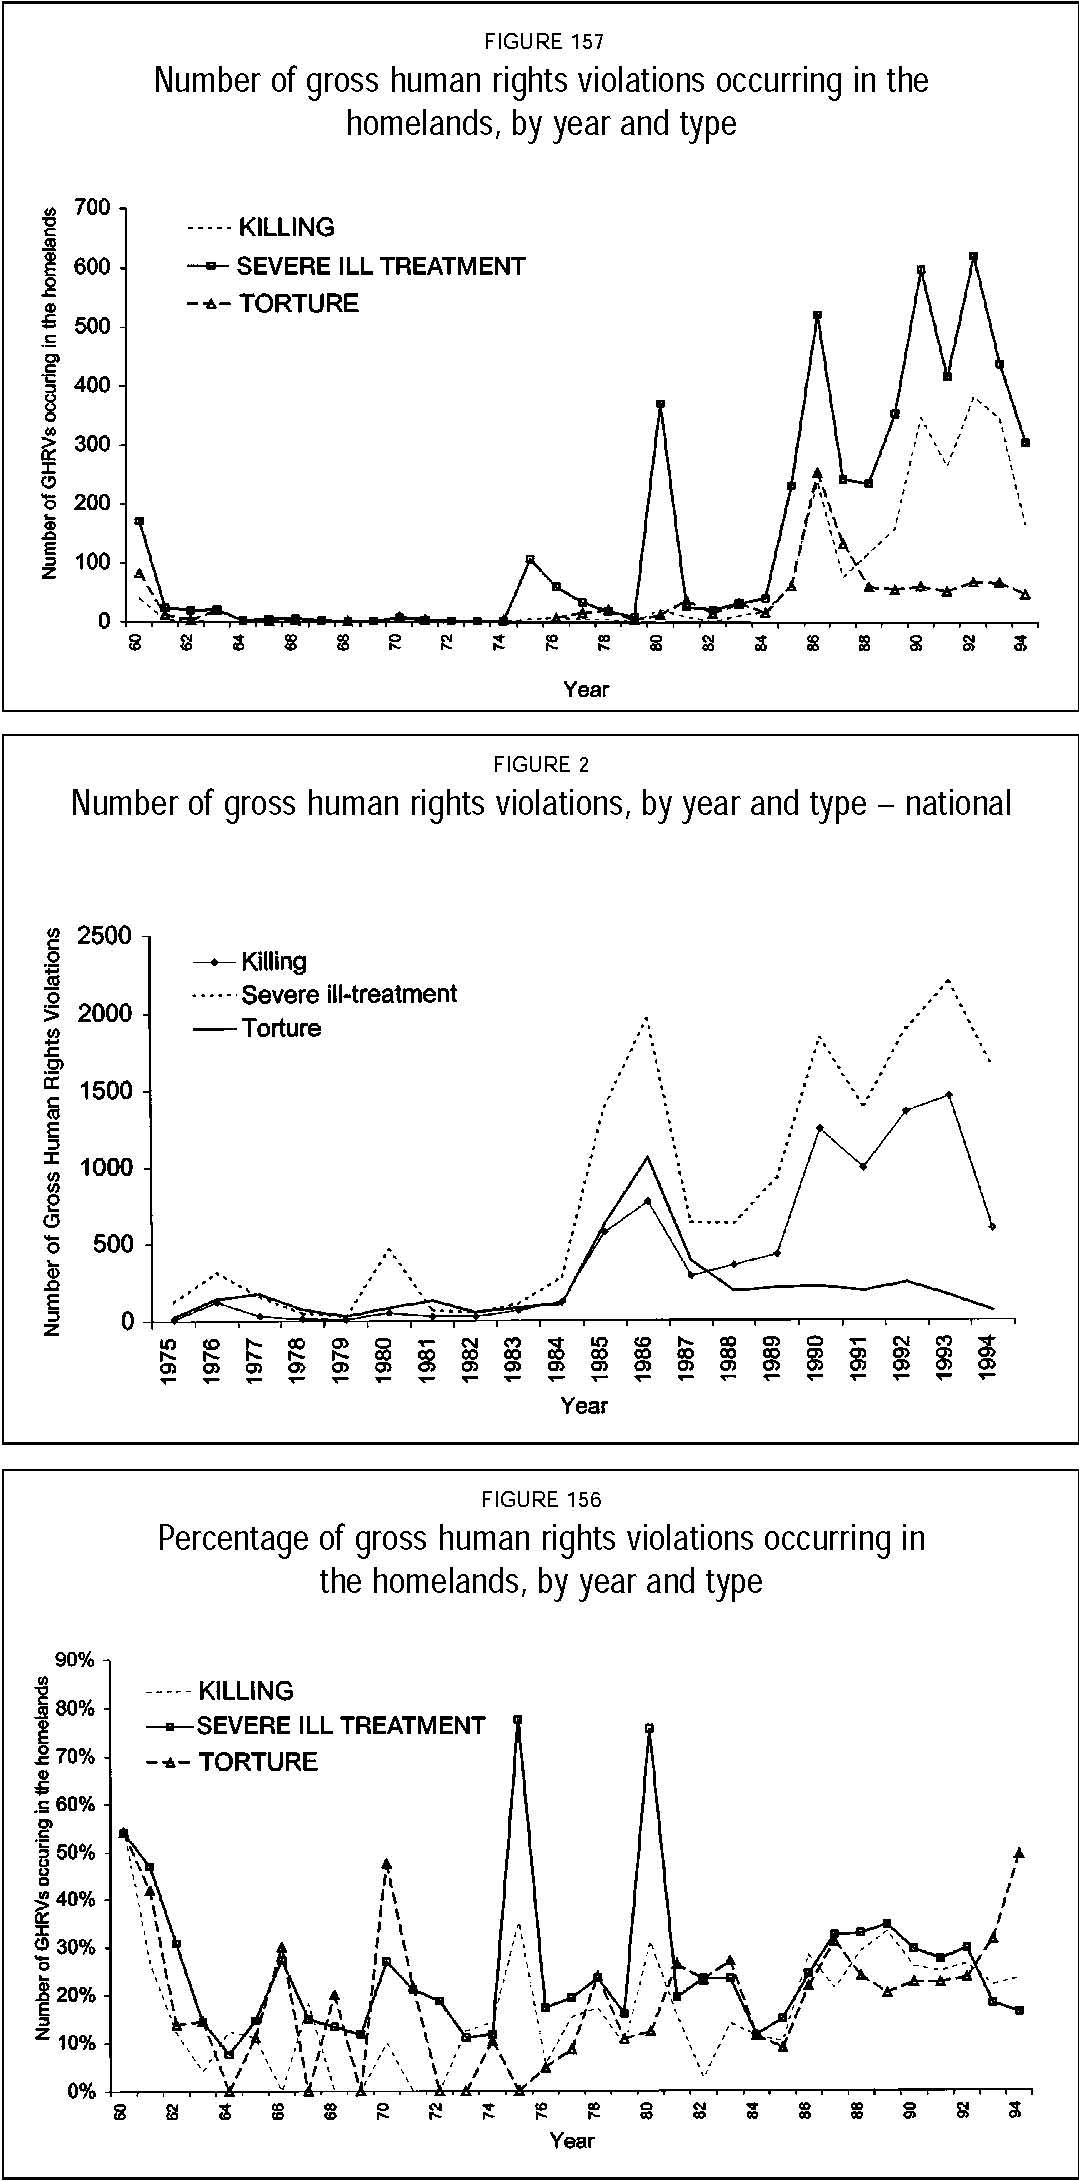
12 It is clear that the ratios in respect of types of violations reported to the Commission for the homeland areas are virtually identical to the ratios for violations reported for non-homeland areas. This indicates that the existence of the homelands did not have a substantial impact on the types of violations experienced there. 13 The correlation between violations experienced in the homelands and in the rest of the country is again illustrated by the following graphs:  14 Note that figure 157 runs from 1960 to 1994, while Figure 2 runs from 1975 to 1994; also that the vertical axis is calibrated differently. However, these graphs both show similar peaks and troughs in violations for the period from the mid-1970s to 1994. Both show severe ill treatment as the key violation, with killings increasing but torture declining during the 1990s. 15 Figure 156 shows how many of the violations reported to the Commission occurred in the homelands regions. Despite the increases and decreases in violations recorded here, the mean number of violations reported in the homelands remains a constant 35-40 per cent of total violations reported. The years recording the highest percentage of violations in the homelands are 1975 (the year before the Transkei gained independence) and 1980 (see those specific periods, below). |