 |
News | Sport | TV | Radio | Education | TV Licenses | Contact Us |
 |
News | Sport | TV | Radio | Education | TV Licenses | Contact Us |
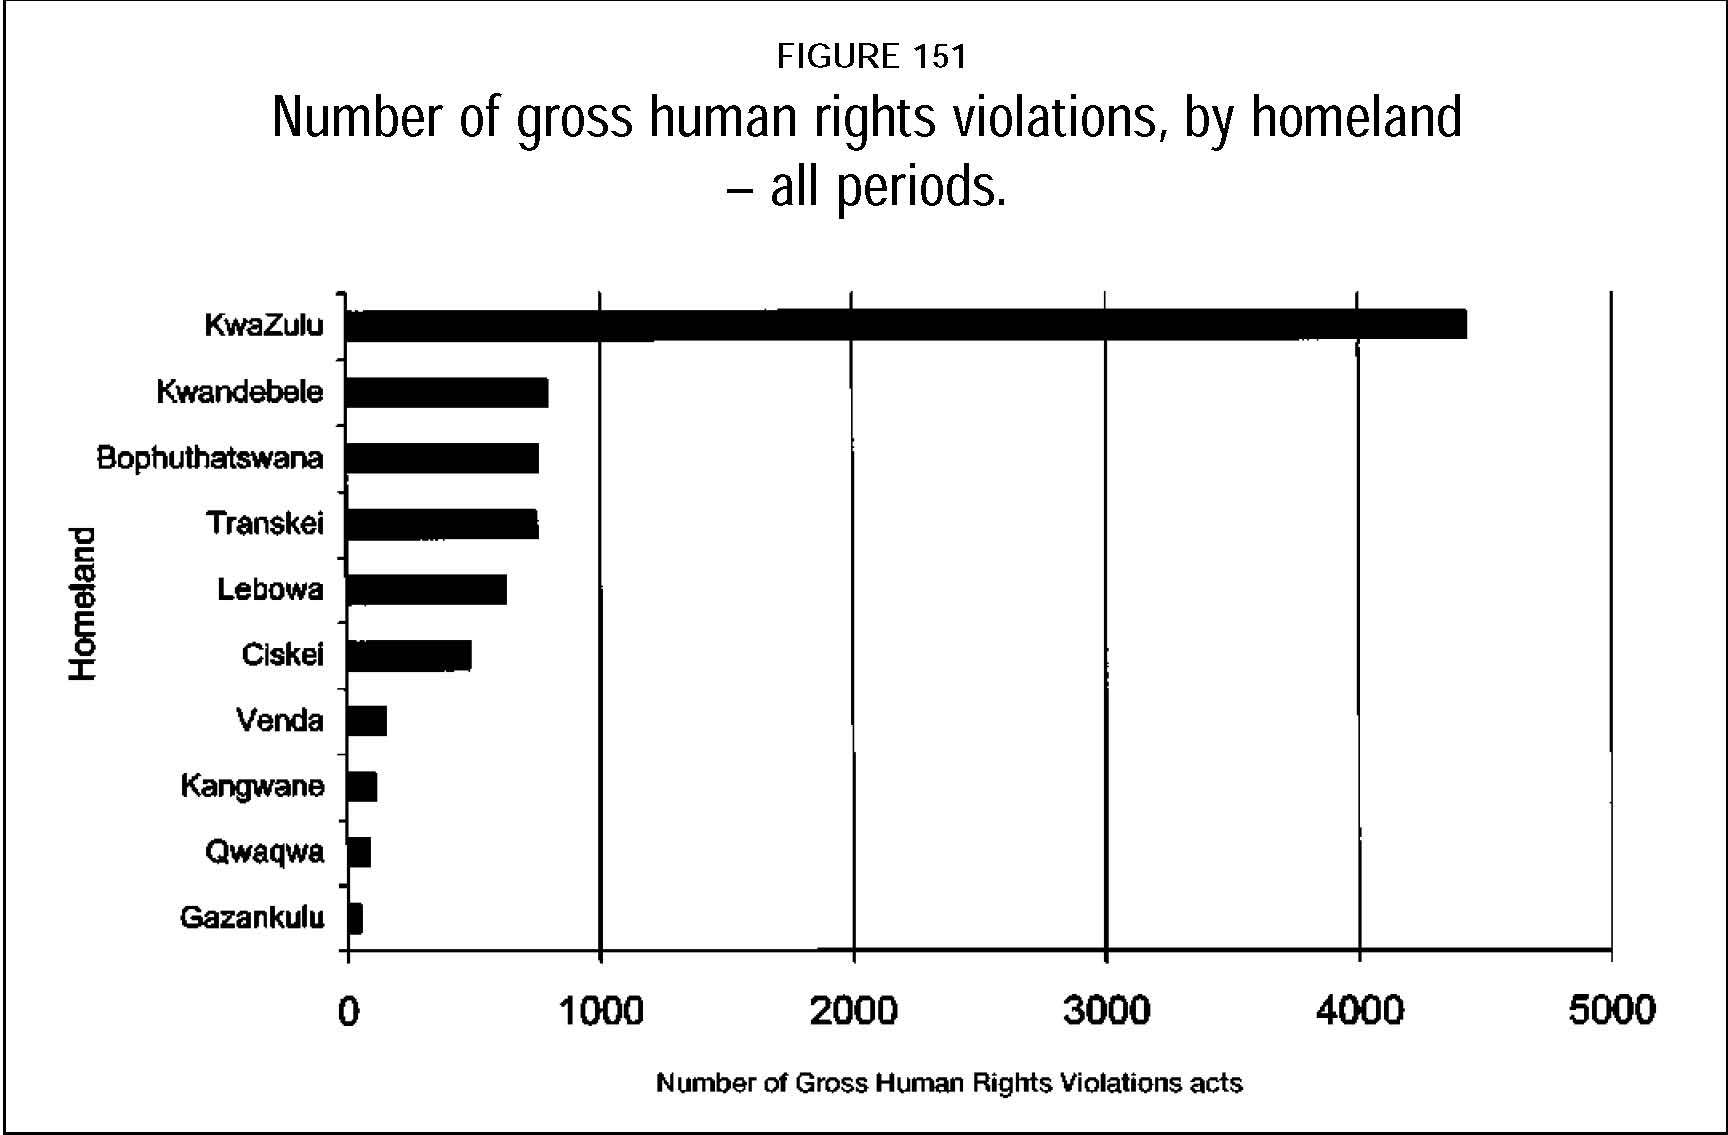
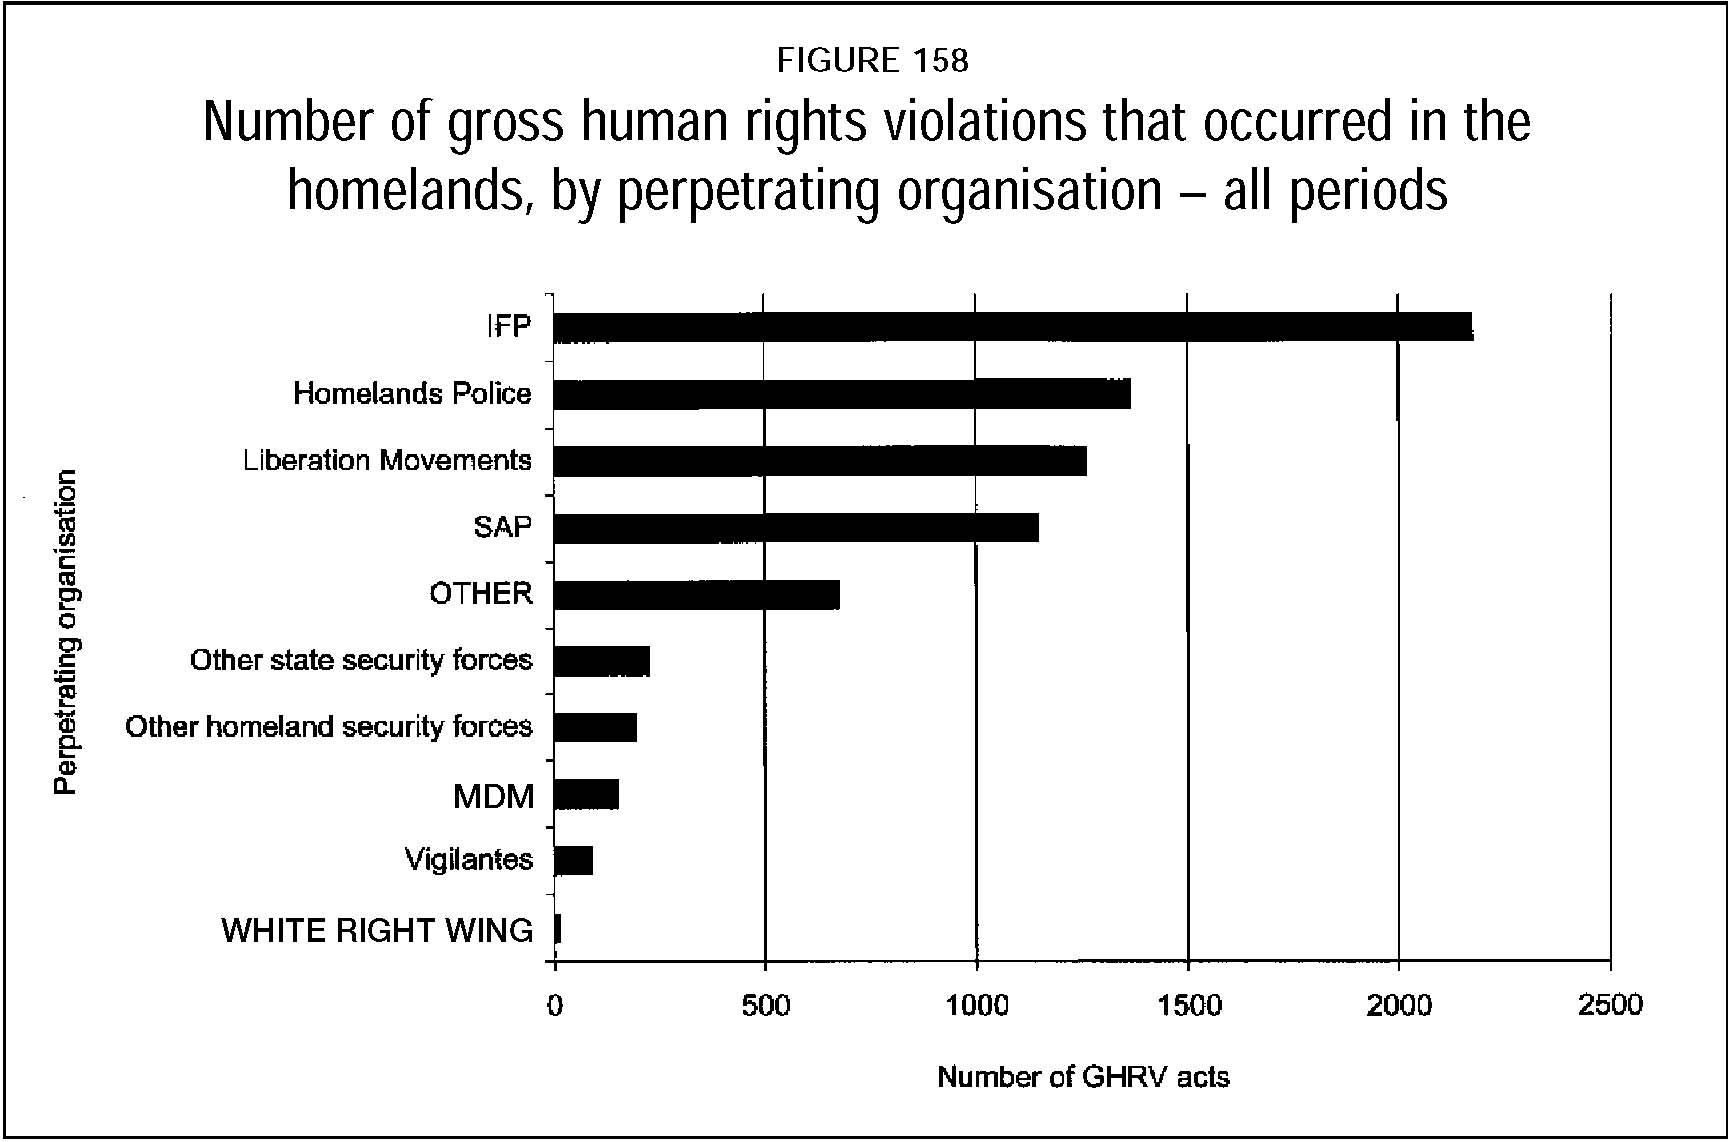
TRC Final ReportPage Number (Original) 404 Paragraph Numbers 16 to 18 Volume 2 Chapter 5 Subsection 3 16 These graphs point towards a similarity in the occurrence of violations nationally and in the homelands, indicating a similarity in policies towards opponents by both national and homeland administrations.  17 From figure 151, it is clear that overwhelmingly the greatest number of violations reported for the homelands for the overall 1960-94 period occurred in KwaZulu. Almost five times as many violations were reported in KwaZulu as for the next homeland in the graph, KwaNdebele. There is a negligible difference in the number of violations reported overall in Bophuthatswana, KwaNdebele, Transkei, Lebowa and Ciskei. It is worth noting that, according to the information in this figure and leaving aside the case of KwaZulu, whether a homeland was independent or self-governing seems to have made little difference to the number of violations. For an indication of how this trend changed over time, see the rest of this series of graphs under each time period below: note the different scales of the horizontal axes in these graphs, which indicate a substantial increase in violations for the later periods. 18 Figure 158 shows the main perpetrator groups, with Inkatha as the dominant perpetrator group over the entire 1960-94 period; it should be borne in mind that Inkatha is almost entirely limited to the KwaZulu homeland, one of the ten geographical areas under consideration. Inkatha is followed by the homelands police, the liberation movements and the South African Police (SAP). Note that the SAP, homelands police and other security forces are split into separate groups, although it seemed that deponents were often unable to distinguish between these groups. 
|